ZOE Covid estimates and the 3 day bug
Here is a story about the ZOE Health Study, told through graphs.
- 1. “Daily percentage of contributors who report new symptoms.”
- 2. Zooming in on the wiggle.
- 3. The drop was caused by a bug in the app.
- 4. The ZOE “daily new cases” number is a 14 day average.
- 5. The effect of 3 low days on a 14-day average.
- 6. The change in the 14-day average.
- Appendix: An alternative “early warning system”.
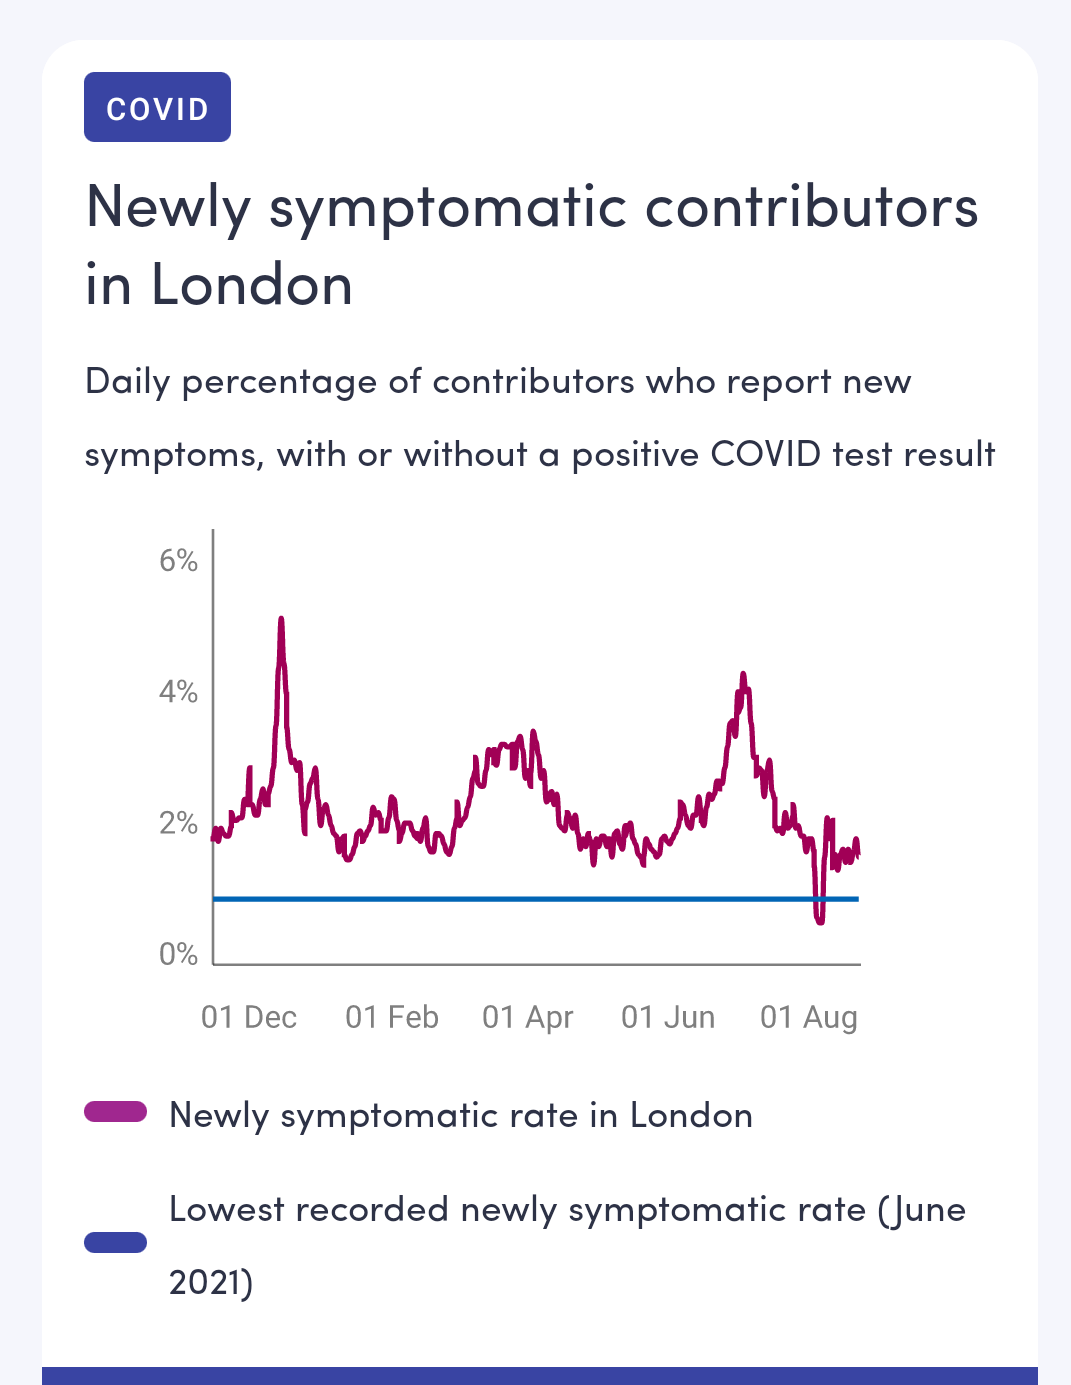
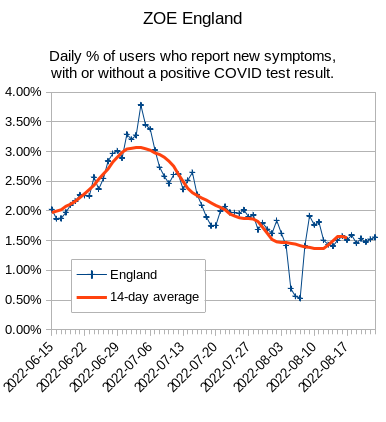
1. “Daily percentage of contributors who report new symptoms.”
There is a big wiggle in early August.
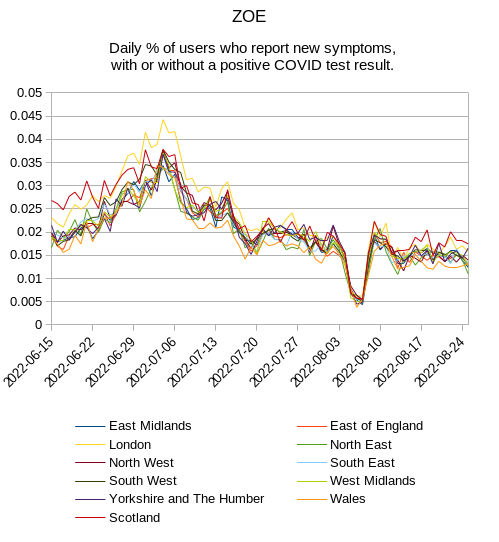
2. Zooming in on the wiggle.
I grabbed the daily data, using the link in the app source code.
The wiggle really stands out. On August 5, 6 and 7, the value drops to just over 0.5%. Either side of the drop, the value is over 1.5%.
3. The drop was caused by a bug in the app.
On August 5, 6 and 7, there were 5 app reviews from people saying they couldn’t log on the app. Specifically, that they couldn’t log themselves as “unwell”.
![Google Play Apps [Android]. August 5, 2022. Worse since intro of 'usual self'. This app worked really effectively during the height of the first wave of the pandemic, and I used it daily. Now I hardly use it at all as it crashes all the time and it's really frustrating. If you try to add anything to say you are feeling different from your usual self, you get a 'sorry, nope' message and it refuses to log. So you are either going to get false data as people will just say they are fine as that is what will log, or no data at all. Please fix!](/assets/for-post/2022-08-24-zoe-covid-3-day-bug/app_review.png)
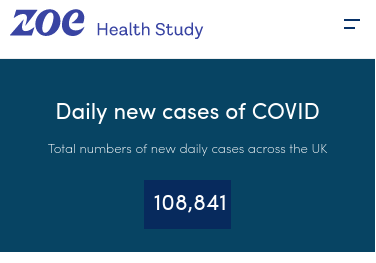
4. The ZOE “daily new cases” number is a 14 day average.
This is the number shown on the ZOE website:
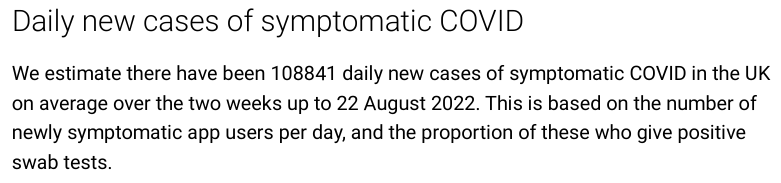
It is described inside the ZOE app, in today’s COVID Infection Report:
5. The effect of 3 low days on a 14-day average.
For simplicity, imagine everything is equal. Imagine the testing data is flat.
When 3 very low days enter a 14-day average, the average will dip. When 3 low days leave the average, the average will jump back.
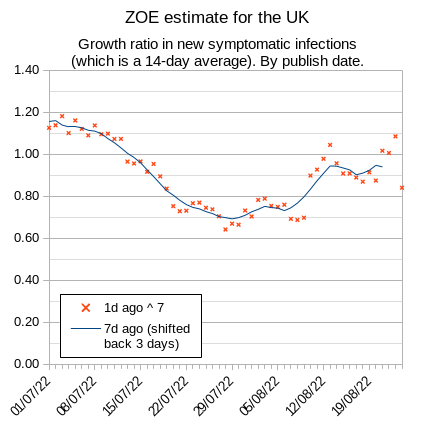
6. The change in the 14-day average.
The bug caused ZOE “daily new cases” to rise over the previous three days. This made some people worried it was the start of a new wave.
Today, “daily new cases” dropped below the low point from four days ago.
We can graph the change in cases as a ratio. When the growth ratio is less than 1.0, the number of cases is falling.
Appendix: An alternative “early warning system”.
Previous “Omicron” variants increased this weekly growth rate by 60 percentage points.
Experts measured significant growth advantages in these variants before they caused large waves of infections.
I made a twitter list of experts you might like to follow. I chose these experts for a high signal-to-noise ratio, about variants specifically.
Other factors can cause waves, such as seasonality and waning immunity. However, I think these will change more gradually. They will not cause a spike that appears to come out of the blue, like the original Omicron variant did.
The scripts and spreadsheets used to produce these graphs are available on GitHub.