ZOE Covid Study - public data files
- 1. Disclaimer
- 2. ZOE data is published on Google Cloud Storage
- 3. Main data files
- 4. All available files
1. Disclaimer
This is not an endorsement of ZOE estimates, or their public communications.
ZOE methods are not fully specified. I notice some errors in ZOE communications, but I do not find every error. I have not found much comment from independent experts.
I am not an expert.
2. ZOE data is published on Google Cloud Storage
ZOE collect COVID-19 test results and symptoms using a survey app. They estimate cases in the UK, which they show on their website. More detailed information is shown on a web page “for app users only”, which might motivate people to take part.
The detailed graphs are also published under “covid-public-data” on Google Cloud Storage, along with other data files. The report published today (31 January, 2022) can be downloaded from this URL:
https://storage.googleapis.com/covid-public-data/report/covid_symptom_study_report_20220131.pdf
There is an online file browser, but it is slow. If you try to download multiple files at once, it says you need to use gsutil cp. See official instructions to install gsutil. Alternatively, some Linux users may prefer to install gsutil using Snap.
I have also put a few related scripts up on GitHub.
3. Main data files
New data files are added each day. You can download a different day by changing the date in the URL (in the address bar of your web browser). Note some older versions use different formats and different definitions. Here are links to the files added today:
3.1 covid_symptom_study_report_20220131.pdf
Update for 23 August 2022: the latest report(s) use a different naming scheme. The report published on that day is called zoe_health_study_report_20220823.pdf.
“Daily COVID Infections Report”. “Analysis by ZOE and King’s College London”. The report includes:
- An explicit note that ZOE use a 14 day average for their case estimates.
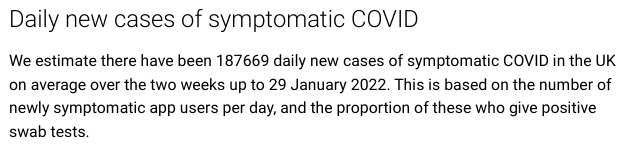
- UK incidence estimates [“daily new cases of symptomatic COVID”], graphed over time:
- Incidence overall
- Incidence within people “double vaccinated” (2 doses or more)
- Incidence rates by UK nation
- Incidence rates by English region
- Incidence of respiratory symptoms: COVID vs non-COVID
- Changelog
…and more. Please remember the disclaimer above. I am not attempting to list what is “wrong” here. E.g. known weirdnesses, unspecified methods, or limitations which might not have been stated by anyone.
3.2 incidence_20220129.csv
Incidence time series, estimated using data from test specimens up to 2022-01-29. Each estimate is an average, for the 14-day period ending in the specified date. I interpret the remaining columns as:
- Lower and upper “confidence intervals”. These match current ZOE graphs, except for the “by vaccination status” graph. To put it politely, I think these are under-specified. See ZOE confidence intervals.
- Raw aggregates over the 14-day period, without re-weighting:
- “Newly sick” users. This covers a wide range of possible symptoms (pre-test data). “Newly sick” users were invited to take a free PCR test if they live in England. [Update: PCR invitations stopped at some point. ZOE users continued to take lateral flow tests and submit their results].
- Total tests, and positive tests. These only include people who were “newly sick”.
- The number of “active” reporting users. Originally “active” meant at least one report in the previous 9 days. However ZOE now say they have widened the definition.
- Regional population. Used to convert estimates of case rates into estimates of absolute case numbers.
Note that “active users” is not the total of the numbers for the individual 14 days. I interpret it as a denominator for “newly sick” ÷ 14. Similar raw aggregate data was previously available in the separate file incidence_table.csv.
3.3 prevalence_history_20220131.csv
Prevalence time series [“active cases”] estimated on 2022-01-31.
In a paper from 2020, ZOE derived this prevalence from the 14-day incidence estimates. This calculation uses a curve of recovery probability, estimated from the whole population.
The dates were shifted by one day today, as per the Changelog (see above). So be careful if you compare today’s file to previous ones.
4. All available files
For convenience, here is a full file list. Obtained using gsutil ls -r -l gs://covid-public-data.